

We recently had a client for whom we suggested switching hosts, since the current one was not very good. The client also mentioned that during periods of high traffic, such as when sending newsletters, the website started to become unresponsive and sluggish. They were using SiteGround, by the way.
After the client agreed to switch hosts, they scheduled the migration, and everything went well. Within a couple of hours, they were running their business on a much better host, with everything running much faster. However, that was the calm before the storm.
During the first newsletter sent on the new host, the same issue returned. The website was either not loading at all or had page load times of 10+ seconds. Why? Well, here is everything we learned and how we managed to fix it.
The numbers
According to Cloudflare, the website had the following numbers during the period when it was unresponsive:
- 2.31k page views in 1 hour. Out of those, 73% (1.69k) were uncached.
- 47.12k requests in 1 hour. A request is any request for a single file or path, such as a single .css file. Out of those, 14% (6.44k) were uncached.
These are pretty bad numbers, especially when considering that the user journey is known in advance, since this traffic was driven by a newsletter.
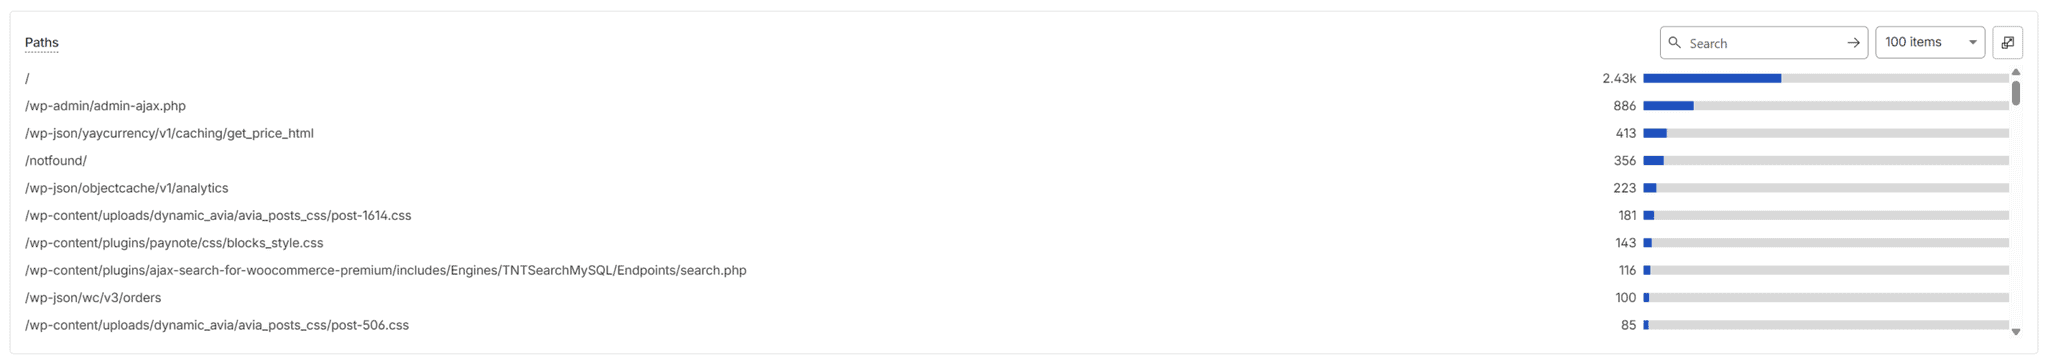
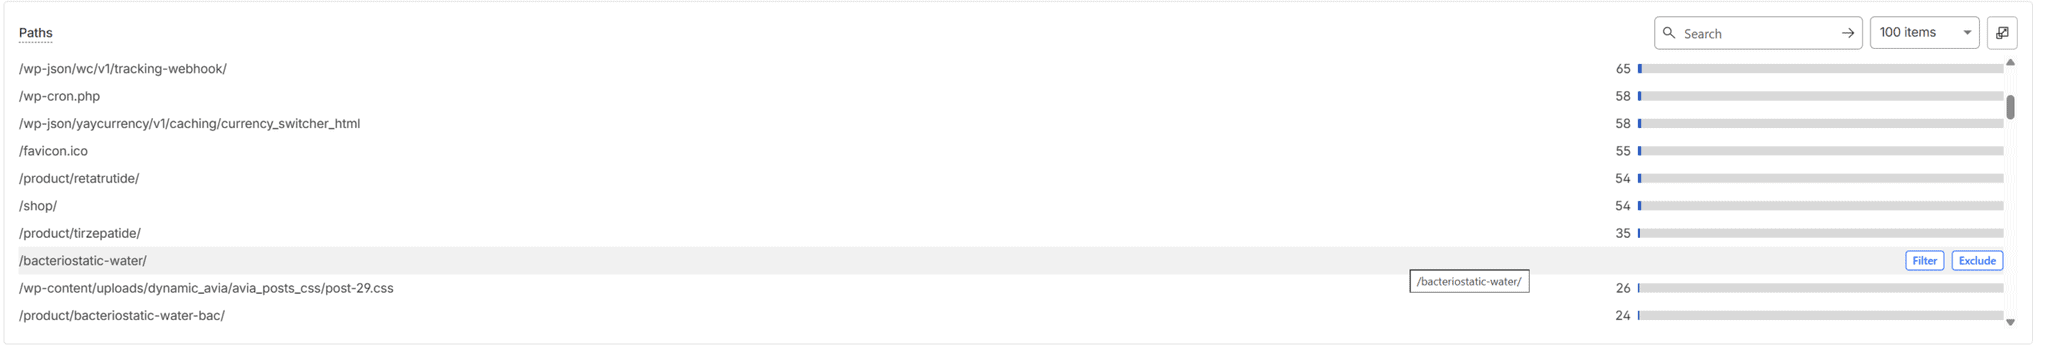
And here are some screenshots showing the uncached paths and query strings.
The suspected problems
After inspecting all the numbers and analytics, there were quite a few apparent issues that needed to be addressed.
- First, the homepage was the number one uncached path. Strange, considering that it is a mostly static page with only a couple of sliders. However, it is important to take into account that these homepage requests also include query strings, such as
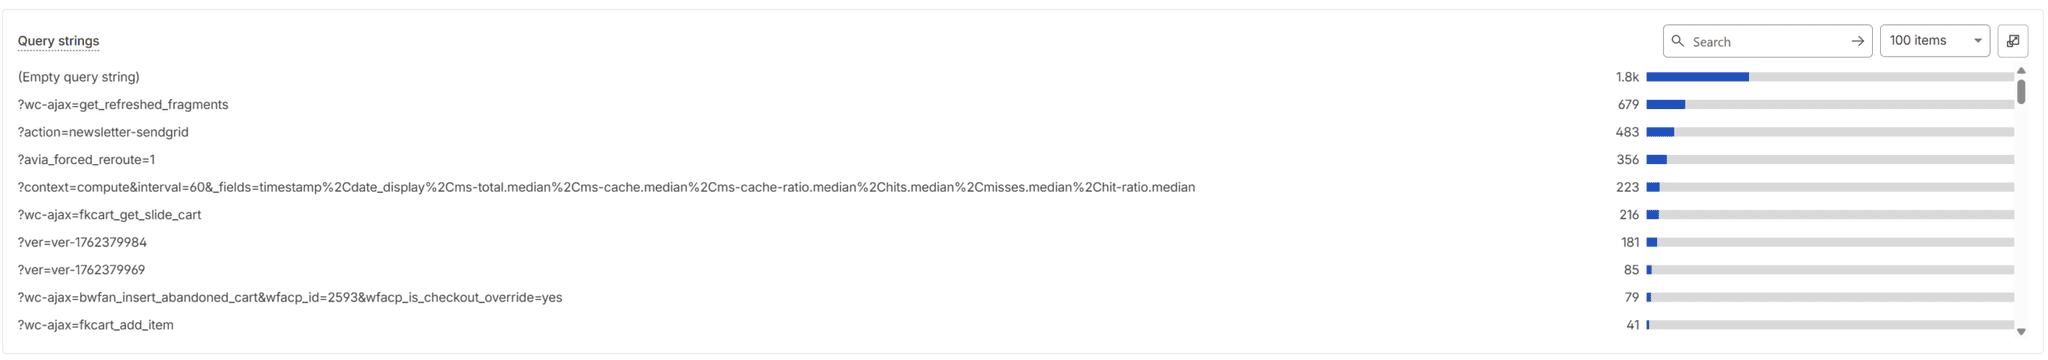
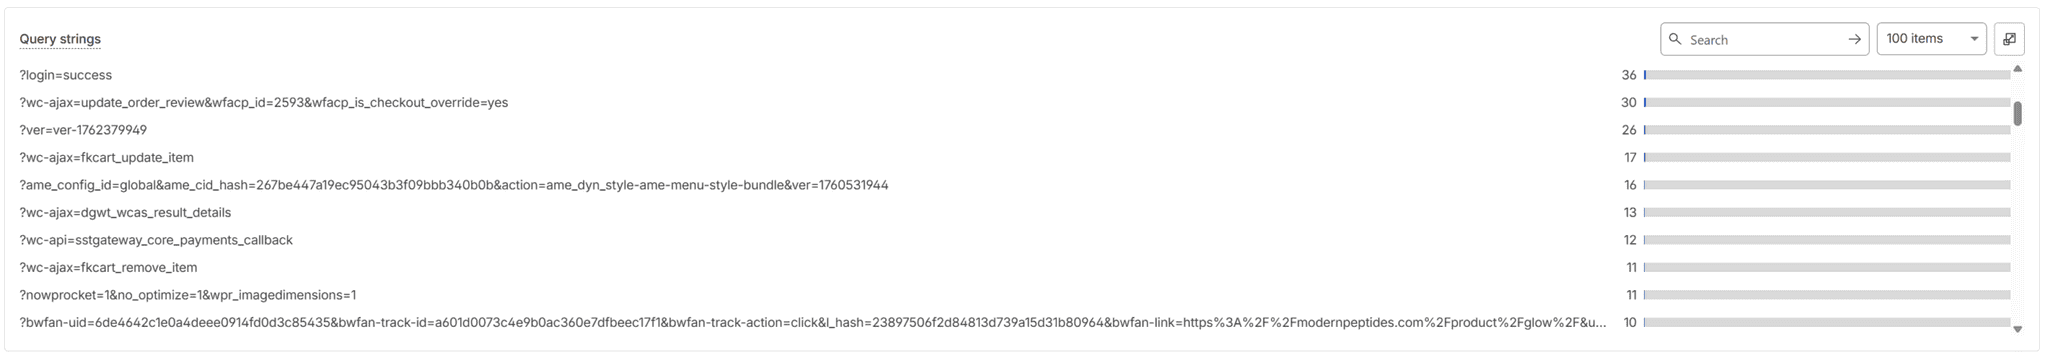
?parameter=valueand other uncached query string variations. - We also observed the opposite situation: many uncached paths without any query string. These likely correspond to logged-in users or represent multiple uncached paths, all combined in one single line (see the Query strings uncached – part 1 screenshot)
- Another issue was the path
/wp-json/yaycurrency/v1/caching/get_price_html, which had a lot of requests and belongs to the YayCurrency plugin. - We also noticed a
/notfound/path being called multiple times. Very suspicious. - Several CSS files located in the
/uploads/dynamic_avia/folders were also being served uncached. - The well-known
wc-ajax=get_refreshed_fragmentsrequest makes an appearance here too. - The
action=newsletter-sendgridquery string was called multiple times, signaling a potential issue or misconfiguration with the newsletter sending process. - Another strange one: the
avia_forced_reroute=1query string being triggered many times. What exactly is this?
The explanations and solutions
The bottom line is that there was a lack of optimization, combined with conflicts and poor coding in both the theme and some plugins.
Enfold’s bug
We start with the most serious bug. The client is using the Enfold theme, which is extremely popular but poorly optimized and full of issues. In the theme options, there is a setting called “Delete Old CSS And JS Files?”, with the description: “Check if you want to delete expired CSS and JS files generated by the theme. Only recommended if you are NOT using a caching plugin (since a cached page might still use those files)”

This setting is always left disabled, as we obviously do not want CSS files to be deleted every time the theme options are saved. These files are located in /uploads/dynamic_avia/. The problem is that, due to a bug, even when the setting is disabled, the files still get deleted. So if multiple people are working on the site and keep updating the theme options, the CSS files generated by the theme are removed but the cache pages continue to reference them even though they do not exist. This leads to two major consequences:
- First, the affected pages appear unstyled.
- Second, every time a page tries to load a missing CSS file, Enfold attempts to request that file, fails to find it, and then redirects the request to the
/notfound/page with the?avia_forced_reroute=1query string. So at some point, virtually every page visit, even when the page itself was cached, triggered a request to an uncached page at/notfound/.
To solve this, we created a custom code snippet that forces a cache purge whenever the Enfold theme options are saved:
add_action( 'avia_ajax_after_save_options_page', function( $new_options ) {

	// Object Cache Pro: flush object cache
    if ( function_exists( 'wp_cache_flush' ) ) {
        wp_cache_flush();
    }

	// WP Rocket: full cache purge
    if ( function_exists( 'rocket_clean_domain' ) ) {
        rocket_clean_domain();
    }

}, 20 );
You may notice that we also flush the object cache. This is necessary because the problematic CSS file (already removed from the file system) are kept stored in the persistent object cache. As a result, even after clearing the page cache, the object cache may continue to return outdated information related to the old CSS file.
In the end, even Enfold implicitly acknowledged that there was an issue.
Cart fragments
By default, WooCommerce sites include the following AJAX request:
https://example.com/?wc-ajax=get_refreshed_fragmentsWhen there are a lot of these, they can end up affecting loading times, which is exactly what happened in our case. Many of these cart fragments requests appeared in the logs as uncached requests, adding unnecessary strain to the server.
The cart fragments functionality is used to update the cart total without refreshing the page. Since our client uses a different mini-cart solution with its own total count (FunnelKit Cart for WooCommerce), we were able to easily disable this feature using Perfmatters. For anyone who needs to disable this as well, their tutorial is very easy to follow: Disable WooCommerce cart fragments AJAX (wc-ajax=get_refreshed_fragments)
YayCurrency
The client also uses a plugin called YayCurrency, which allows customers to switch currencies on the fly. This plugin is responsible for those /wp-json/yaycurrency requests. Basically, every time a customer loaded a product page where the currency switcher is present, the plugin made an uncached background request to retrieve the exchange rates for all the currencies selected by the administrator. If 100 customers accessed the same product page at the same time, this equaled to 100 uncached background requests. Not good.
This is actually a behaviour introduced by the plugin itself and is presented as “cache plugin compatibility”.

Since currency rates do not change significantly within a single day, the solution was easy. We disabled the cache compatibility feature and told the plugin to update exchange rates once per day from the backend, instead of fetching them from the frontend as it was previously doing.
Newsletter tracking
We also saw a large number of uncached action=newsletter-sendgrid query strings. We were not able to determine exactly what triggered these requests, but they were clearly related to the newsletter sending process. Most likely, this was caused by a tracking configuration that could have been easily disabled, and so we did.
PHP workers
Finally, there was one issue that could not be easily found by simply looking at the logs. Cloudways, which was the chosen hosting provider, sets a default maximum of 40 PHP workers on its Cloudways Flexible plans, at least when deploying a Vultr server with up to 8 CPU cores. There is no right or wrong when it comes to the number of PHP workers, but we discovered that all the uncached requests described above were causing PHP to spawn all 40 workers.
A PHP worker is a server process that executes PHP scripts to handle web requests. When a user visits a page, it’s 1 worker that handles that requests, and that worker runs in 1 core. The problem here was that the server deployed by the client initially had 4 cores (later upgraded to 8 cores), so even when each core was already fully busy with running one PHP worker, PHP continued to spawn additional workers, consuming RAM and, more importantly, preventing the CPU cores from working efficiently: instead of finishing one task, each core was jumping from worker to worker trying to attend everybody. In other words, the CPU became saturated the same way a single cashier would trying to handle 10 different queues of people at the same time.
And sure enough, after running load tests with different configurations, we found that, for this specific site, the most stable performance was achieved when the maximum number of PHP workers was set equal to the number of CPU cores, or at most one or two workers above that number.
Conclusion
So there’s that. The two main problems were a lack of optimization and a misconfigured server. And we learned that even if the raw performance metrics appear better on certain hosting providers, sometimes you need to fine-tune both the application and the server configuration to achieve the best possible results.